| Issue |
Agron. Sustain. Dev.
Volume 30, Number 2, April-June 2010
|
|
|---|---|---|
| Page(s) | 445 - 453 | |
| DOI | https://doi.org/10.1051/agro/2009048 | |
| Published online | 16 April 2010 | |
Research article
Subplots facilitate assessment of corn yield losses from weed competition in a long-term systems experiment
USDA-ARS Sustainable Agricultural Systems Lab, Building 001 Room 245, 10300 Baltimore Avenue,
Beltsville, Maryland
20705, USA
* Corresponding author:
This email address is being protected from spambots. You need JavaScript enabled to view it.
Accepted: 15 October 2009
Abstract
Weeds can limit crop yield, particularly in organic systems where herbicide technologies are unavailable. Weedy and weed-free subplots were established within the full plots of a long-term Farming Systems Project at Beltsville, Maryland, USA, to determine the effect of weed competition on corn yields in six of the first ten years of an experiment designed to compare conventional and organic cropping systems. Weed abundance was determined in two ways, by sampling above-ground biomass and by estimating percent of soil area covered by weeds. Percent weed cover was shown to be linearly related to weed biomass but was more comprehensive than biomass sampling for determining the overall weed abundance in the larger full plots. The relationship between corn yield and weed cover estimates in subplots was used to estimate corn yield losses to weed competition and weed-free yield in the full plots. Weed competition reduced corn grain yield in all years in subplots, however, the degree of yield reduction ranged from 4 to 76%. This considerable variability was explained by rainfall whereby the highest yield loss occurred in years with below-average rainfall and the lowest yield loss occurred in years with above-average rainfall. Estimation of full-plot corn yield loss to weed competition demonstrated that yield differences between the conventional and organic systems were explained not only by weed competition but also by nitrogen availability. Results suggested that, in years with above-average rainfall, nitrogen availability was more limiting to organic corn yield than weed competition, but that, in years with below-average rainfall, weed competition was more limiting than nitrogen availability.
Key words: corn / Zea mays / weed competition / nitrogen availability / rainfall / organic farming
© INRA, EDP Sciences, 2009
1. INTRODUCTION
Agricultural practitioners are currently challenged by the rising cost of inputs including fertilizers and herbicides, the need to use scarce resources more efficiently, and the need to adapt to and mitigate global warming effects. Agricultural systems utilizing no-tillage and organic farming have been promoted and researched as solutions for developing more sustainable practices that address these challenges. Organic farming has several agronomic challenges that may prevent realization of system potential including weed control and nutrient availability. Weed control, in particular, has been identified as a major limitation to organic farming because of the inability to use synthetic herbicides (Waltz, 1999).
Weeds interfere with crop growth and yield through acquisition of required resources including light, water, and nutrients (Kropff and van Laar, 1993) and are potentially a major constraint on crop production if not controlled (Zimdahl, 2004). The competitiveness of weeds is often measured in terms of crop yield reduction per unit of weed population or biomass. Yield reduction can vary greatly as a result of weed species. For example, corn yield was reduced up to 91 percent by competition with 8 Palmer amaranth (Amaranthus palmeri S. Wats) plants m−1 of row (Massinga et al., 2003), whereas corn grain yield was only reduced 13 to 14 percent by 10 giant foxtail (Setaria faberi Herrm.) plants m−1 (Fausey et al., 1997). Broadleaf weeds with a relatively tall, aggressive growth habit were shown to be most competitive with crops in a survey of 162 data sets (Canner et al., 2002).
Despite the certainty that crop yield loss will increase with increasing weed abundance, the degree of yield loss can vary depending on many factors. Research across several locations and seasons showed that corn yield loss per unit weed density varied considerably by location and season (Lindquist et al., 1996, 1999). Soil moisture deficit can enhance crop-weed competition as shown by higher crop yield loss when soil moisture is limiting in droughty years (Cowan et al., 1998; Toler et al., 1996). Likewise, deficient nitrogen conditions can enhance corn yield loss from weed competition compared to conditions with recommended nitrogen levels (Cathcart and Swanton, 2003; Evans et al., 2003; Tollenaar et al., 1994). Cropping systems that rely on organic soil amendments for fertility also can increase the competitiveness of crops with weeds compared to conventional systems that rely on synthetic fertilizer inputs (Gallandt et al., 1998; Liebman and Davis, 2000). More information is needed on the degree of crop yield loss from weeds in alternative cropping systems.
Long-term cropping systems experiments have been initiated in several regions to compare standard and alternative approaches to crop production, usually including one or more systems with recommended practices for fertility and weed management along with alternative systems that include reduced inputs and/or organic farming. Systems are usually defined by multiple confounded factors that can not be easily separated without violating system integrity (Drinkwater, 2002). Since systems experiments usually involve large plots farmed with full-scale equipment and are sampled intensively, it is most practical to arrange experiments in simple designs with relatively few systems along with several rotational entry points within each system. Thus, a factorial assessment of single factors is usually not addressed in the overall design of these experiments. Important factors such as weed control can still be approached by use of subplots within the larger full plots of these experiments (Drinkwater, 2002; Gallandt et al., 1998), although this experimental approach has been used rarely in long-term experiments. Ryan et al. (2010) used weed-free subplots in the 25-year Rodale Farming Systems Trial in eastern Pennsylvania, USA, to show that corn yield potential in organic systems was higher than that in a conventional system in the absence of weeds, whereas corn yields were similar among organic and conventional systems when typical management practices were employed. Teasdale et al. (2007) used weed-free and nitrogen-free subplots during a uniformity trial at the conclusion of a 9-year experiment in central Maryland, USA, to show that corn yield potential was higher following a minimum-tillage organic system than a conventional no-tillage system. In both of these experiments, higher yield potential was associated with higher soil carbon levels and nitrogen availability in organic than in conventional systems but this potential was not realized because of increased weed competition in organic systems. These results confirm that weed competition may be the primary factor limiting corn yield in organic systems.
The Farming Systems Project in Beltsville, Maryland, is a long-term systems experiment that was initiated in 1996 to study grain cropping systems typical of the mid-Atlantic region of the USA. Overall system performance in this experiment has been reported for grain yield (Cavigelli et al., 2008), economics (Cavigelli et al., 2009), weed seedbank dynamics (Teasdale et al., 2004), and carabid beetle community structure (Clark et al., 2006). Lower corn yields in organic than conventional systems were associated with higher weed abundance, lower nitrogen availability, and, to a lesser extent, lower corn populations in these organic systems (Cavigelli et al., 2008). To assess the role that weed competition played in reducing corn yield in this experiment, weed-free subplots were established within the full plots to obtain a direct measure of the yield loss and to estimate weed-free yields in the systems under study. Since nitrogen availability was also shown to be significantly correlated to corn yield, we explored the potential role that nitrogen availability played in explaining corn yield differences unaccounted for by weed competition. Finally, since this rain-fed experiment has encompassed a wide range of rainfall conditions, the relative effect of seasonal weather on yield loss to weed competition and nitrogen availability was also evaluated.
2. MATERIALS AND METHODS
The Farming Systems Project is conducted at the USDA-ARS Beltsville Agricultural Research Center in Beltsville, Maryland. The site and details of the systems have been described in Cavigelli et al. (2008). The cropping systems were initiated in 1996 with all rotational phases of each system present in every year. Four of the systems will be discussed in this paper, a conventional no-tillage (NT) system that is typical of production in this region, a two-year organic corn (Zea mays L.) -soybean (Glycine max (L.) Merr.) rotation (Org2), a three-year organic corn-soybean-wheat (Triticum aestivum L.) rotation (Org3), and a four-year organic corn-soybean-wheat-hay rotation (Org4). The four-year rotation was expanded to a six-year rotation near the end of the first ten-year cycle of this experiment, but, for simplicity, this system will be characterized as a four-year rotation since this was representative of this system during the majority of years reported here. Only details of corn production will be described below, since only the corn phase of each rotation is discussed in this paper.
Corn was planted in early May in the conventional no-tillage system, but in late May in the organic systems to maximize green manure biomass and N content. In all systems, corn was planted in rows spaced 76 cm apart at an average rate of 67600 seeds ha−1. Corn in the conventional NT system followed a year of wheat and double crop soybean production. Recommended inputs of inorganic fertilizers were applied to NT based on annual soil tests and a yield goal of 9.4 Mg ha−1. The average N application rate was 151 kg ha−1 during the years reported in this paper. The herbicide program for NT included 0.56 kg a.i. ha−1 2,4-D (2,4-dichlorphenoxyacetic acid), 0.52 kg a.i. ha−1 paraquat (1,1’-dimethyl-4,4’-bipyridinium ion), 1.90 kg a.i. ha−1 metolachlor [2-chloro-N-(2-ethyl-6-methylphenyl)-N-(2-methoxy-1-methylethyl) acetamide], and 1.94 kg a.i. ha−1 atrazine [6-chloro-N-ethyl-N′-(1-methylethyl)-1,3,5-triazine-2,4-diamine). Beginning in 2004, 1.79 kg a.i. ha−1 simazine (6-chloro-N,N′-diethyl-1,3,5-triazine-2,4-diamine) was added to improve control of late season grasses. Metolachlor and atrazine rates were concomitantly reduced to 1.33 and 0.34 kg ha−1, respectively.
In the organic systems, a legume crop was the primary source of nitrogen but in years when the legume stand was considered too thin to provide adequate nitrogen for corn, animal manure or animal manure compost was applied before planting corn (Cavigelli et al., 2008). A winter annual legume cover crop, hairy vetch (Vicia villosa Roth), was planted in early September in Org3 and in October in Org2. In Org4, a perennial hay crop of red clover (Trifolium pratense L.) plus orchardgrass (Dactylis glomerata L.) preceded corn through 2002, thereafter, alfalfa (Medicago sativa L.) preceded corn. The length of the rotation was extended when alfalfa became the hay crop such that corn in 2004 followed two full years of alfalfa and corn in 2005 followed three years of alfalfa. The hay crop in Org4 was killed using a moldboard plow followed by one to three passes of a disk and/or field cultivator. For controlling weeds in corn, a rotary hoe was typically used twice, about 5 and 10 days after planting, and an inter-row cultivator was typically used twice, about 3 and 4 weeks after planting. Primary tillage in Org2 and Org3 from 1996 to 1998 involved two to three passes with a disk and/or field cultivator. A rotary hoe and a row cultivator were used two times each as described above. From 1999 to 2002 a reduced tillage system was used in Org2 and Org3 where, instead of primary tillage, the hairy vetch cover crop was rolled at flowering using a stalk chopper and left on the soil surface as a mulch. Corn was then planted using a no-till planter and a high residue cultivator was used two to three times to control emerged weeds. Because of poor weed control and a heavy infestation of annual ryegrass (Lolium multiflorum Lam.) in 2002, the more traditional plow-tillage based management protocol as used in Org4 was used from 2003 to 2005.
The four cropping systems were arranged in a randomized block design with four replications. Each plot was 12 corn rows (9.1 m) wide and 111 m long. The terms “plot” or “full plot” are used in this paper to denote this experimental unit with the length of 111 m. The percentage of soil area covered by weeds was estimated visually at weed maturity, usually in early September. Estimates were made within the middle six rows of four 28-m long quadrants of each plot and the data from the four quadrants were averaged to arrive at an overall full plot estimate. Cover estimates also were made for each of the major weed species, however, annual grasses were combined into a single group. Corn grain was harvested from the middle four rows of the entire plot length with a combine and downloaded to a weigh wagon to obtain grain weight. Grain yields were adjusted to 15.5% moisture content. Analyses of variance of weed cover and yield were conducted with cropping system and year as fixed effects and block and block*system as a random effects using a mixed model procedure (PROC MIXED, SAS Version 9.1, SAS Institute, Cary, NC).
After corn establishment, an area with uniform corn population and growth was identified within each full plot for creation of adjacent weed-free and weedy subplots. The term “subplot” is used in this paper to denote these areas that measured four rows (3.0 m) by 6.1 m long. Weed-free subplots were created by hand removing all weeds not controlled by standard system operations. A weedy subplot was established adjacent to each weed-free subplot where populations of uncontrolled weeds following standard weed control operations were representative of the full plot in which they resided. Subplots were only established in plots with substantial uncontrolled weed populations but not in plots with few weeds, thus, systems with good weed control, particularly NT, did not have subplots in selected years. Subplots were established beginning in 1997 and were continued each year until 2005 except for the exceptionally dry year of 1999 when no crops were harvested and the exceptionally wet year of 2003 when soggy conditionsprecluded establishing weed-free plots. In 2000, soils were also too wet in spring to establish weed-free subplots, but weedy subplots were established in late season for comparisons of weed cover and biomass measurements as described below.
At the same time that weed cover estimates were made of the full plots at weed maturity, cover estimates were also conducted for the middle two rows of the weedy subplots. At corn maturity, weeds and crops from the middle two subplot rows were hand harvested, and dry weight of weed biomass and corn grain were determined. Corn grain yield was adjusted to 15.5% moisture content. Analyses of variance of subplot weed cover, weed biomass, and corn yield were conducted with cropping system and year as fixed effects and block and block*system as random effects using the mixed model procedure. The relationship between weed biomass and weed cover ratings in the weedy subplots was explored using an analysis of covariance with a no-intercept model. This analysis included weed biomass as dependent variable, total weed cover and a variable equal to the percent species composition contributed by smooth pigweed (Amaranthus hybridus L.) plus common lambsquarters (Chenopodium album L.) as independent regression variables, and the interaction of these two regression variables with the class variables year or cropping system making up the initial full model. A backward elimination process was employed to reduce this model to include only significant variables (P < 0.05).
The corn yield loss due to weeds was determined from each pair of weedy and weed-free
subplots
 where
Ls is the percent yield loss in subplots,
WFYs is the yield in the weed-free subplot, and
WYs is the yield in the paired weedy subplot. A mixed model
analysis of variance was performed on subplot yield loss,
Ls, with system and year as fixed effects
and block and block*system as random effects. A database of the yield loss values from each
pair of weedy and weed-free subplots and the corresponding weed cover in the weedy subplot
was used to conduct a regression analysis of yield loss as a function of weed cover. An
analysis of covariance was performed with total weed cover and pigweed+lambsquarters
composition as regression variables along with their interactions with the class variables
year or system using a no-intercept model. A backward elimination process was followed to
eliminate non-significant terms from the model (P < 0.05). Based on
the results of this analysis, the rate coefficient of percent yield loss per unit percent
weed cover, R, was determined for each year.
where
Ls is the percent yield loss in subplots,
WFYs is the yield in the weed-free subplot, and
WYs is the yield in the paired weedy subplot. A mixed model
analysis of variance was performed on subplot yield loss,
Ls, with system and year as fixed effects
and block and block*system as random effects. A database of the yield loss values from each
pair of weedy and weed-free subplots and the corresponding weed cover in the weedy subplot
was used to conduct a regression analysis of yield loss as a function of weed cover. An
analysis of covariance was performed with total weed cover and pigweed+lambsquarters
composition as regression variables along with their interactions with the class variables
year or system using a no-intercept model. A backward elimination process was followed to
eliminate non-significant terms from the model (P < 0.05). Based on
the results of this analysis, the rate coefficient of percent yield loss per unit percent
weed cover, R, was determined for each year.
Weed-free yields for the full plots were estimated from a combination of full plot and
subplot data. The yield loss rate, R, derived from the subplot data as
described above was multiplied by the percent weed cover for the full plot to estimate the
percent yield loss for the full plot, Lf. When
R was not significant in 2004, percent yield loss was estimated to be 0.
The weed-free yield for the full plot was then estimated by  where WFYf is the estimated weed-free yield of the full plot,
Yf is the harvested yield from the full
plots, and Lf is the estimated percent yield
loss in the full plots. A mixed model analysis of variance was performed on weed-free yield
estimates, WFYf, with system and year as fixed effects and block
and block*system as random effects.
where WFYf is the estimated weed-free yield of the full plot,
Yf is the harvested yield from the full
plots, and Lf is the estimated percent yield
loss in the full plots. A mixed model analysis of variance was performed on weed-free yield
estimates, WFYf, with system and year as fixed effects and block
and block*system as random effects.
A regression analysis was conducted on estimated weed-free yield as a function of estimated nitrogen availability. Details for estimating nitrogen availability are described in Cavigelli et al. (2008). In brief, 100% of fertilizer nitrogen was assumed to be available, 50% of above-ground green manure nitrogen content was assumed to be available, the underground nitrogen content of perennial green manure crops was added to the available above-ground portion, and nitrogen availability from manure and compost was determined from University of Maryland recommendations based on the initial content of organic and ammonium nitrogen and the time between application and incorporation.
3. RESULTS AND DISCUSSION
Data from paired weedy and weed-free subplots within the full plots of a long-term Farming Systems Project, Beltsville, Maryland, were analyzed to determine the effect of weed competition on corn yields in conventional and organic cropping systems during six of the first ten years of this experiment. There were significant (P < 0.05) cropping system main effects for all full plot and subplot weed and grain yield variables and there were significant interactions between system and year for most of these variables. Consequently, results are shown by system and year (Tabs. I and II).
3.1. Weed control
In the full plots, weed control in the conventional NT system tended to be variable across years (Tab. I). The initial herbicide program allowed annual grasses [primarily fall panicum (Panicum dichotomiflorum Michx.) and giant foxtail] and perennial broadleaves [primarily dandelion (Taraxacum officinale Weber in Wiggers), curly dock (Rumex crispus L.), and horsenettle (Solanum carolinense L.)] to escape control in mid-summer and develop significant cover by September in the early years of the experiment. This problem was particularly pronounced in 2001, when high mid-season rainfall likely facilitated the degradation of preemergence herbicides and the emergence of grass weeds, resulting in 50% weed cover by late-season (Tab. I). Late season grass control and overall weed control improved considerably because of dry mid-season weather in 2002 and the addition of a preplant simazine application to NT in 2004 and 2005.
Weed cover was higher in Org2 than in NT in every year in full plots (Tab. I). Weed cover was relatively low in organic systems during the early years of the experiment and increased to the highest levels in 2001 and 2002 before declining in 2004 and 2005. This pattern is explained partly by a buildup of the weed seedbank from low levels at the initiation of this experiment (Teasdale et al., 2004) and partly by the adoption of a reduced-tillage system for managing cover crops in the organic systems from 1999 to 2002 that was ineffective at controlling weeds. After 2002, a plow-tillage system including delayed planting into a stale seedbed followed by rotary hoeing and sweep cultivation was adopted and provided more effective weed control than the reduced-tillage system. The weed community in the organic systems was dominated by smooth pigweed and common lambsquarters that, in combination, made up on average 82 percent of the weed cover in organic full plots across all years. These species were less abundant in the conventional NT system, which had a relatively higher percentage of annual grasses and perennial weeds as described above.
The longer organic rotations had better weed control than the two-year organic rotation (Org2) in most years. The three-year (Org3) and four-year (Org4) organic rotations had lower weed cover than Org2 in 4 of 5 years in full plots (Tab. I). Lower weed abundance in the longer organic rotations was correlated with a lower soil weed seedbank (Teasdale et al., 2004). The longer rotations included a greater diversity of crop phenology and management practices that resulted in a greater number of weed mortality events distributed across the growing season. Planting and weed control operations in the two-year rotation of summer annual crops, corn and soybean, were conducted at a similar time each year, which favored summer annual weeds such as smooth pigweed and common lambsquarters that were adapted to survive these operations. The three-year rotation, including a winter annual wheat crop, and the four-year rotation, including wheat and a perennial hay crop, denied smooth pigweed and common lambsquarters this niche for establishment during the wheat and hay rotational years. As a result, overall seed production and population levels of these summer annual weeds were lower in the longer rotations with more diverse crop phenology than in the shorter, less diverse two-year rotation (Teasdale et al., 2004).
Variables measured in the weedy subplots exhibited a similar pattern to the corresponding values measured in the full plots over all years (Tabs. I and II). The correlation between weed cover in the weedy subplots and full plots was 0.78 (P < 0.0001) while the correlation between pigweed+lambsquarters composition in the weedy subplots and full plots was 0.85 (P < 0.0001). The correlation between corn grain yield in the weedy subplots and full plots was 0.96 (P < 0.0001). These strong correlations suggest that the weedy subplots were highly representative of the full plots.
Models for defining the relation of weed biomass and weed cover ratings at the Beltsville Farming Systems Project. The overall model of weed biomass, W (g m−2, as a function of the percent total weed cover, C, and the sum of the percent composition of smooth pigweed plus common lambsquarters (P + L) had significant C × Year and C × (P + L) × Year interactions (n = 69, P < 0.0001, R2 = 0.819).
3.2. Relationship between weed biomass and weed cover
Weed biomass and weed cover in the weedy subplots exhibited a similar pattern of response to cropping system across years (Tab. I). Regression analysis showed a strong linear relation between biomass and cover in subplots, however, the biomass to cover relationship was dependent on species composition and annual weather conditions, thereby precluding derivation of a common relational coefficient across all years. Specifically, analysis of covariance showed that weed biomass was significantly related to the year by weed cover and the year by weed cover by pigweed+lambsquarters composition interactions (Tab. III). It is reasonable that the relationship between weed biomass and weed cover was influenced by year (leading to a significant cover by year interaction) because weed biomass production per unit of soil surface area would be expected to vary according to the weather conditions within a given year.
The significant interaction between weed cover and pigweed+lambsquarters composition is reasonable because a weed community dominated by smooth pigweed and common lambsquarters plants, which are relatively tall with dense stem tissue, would be expected to have a higher biomass per unit soil area than a community dominated by the more leafy annual grasses or perennial broadleaf plants present at this site. During 1997, 2000, and 2001, there was a wide range of pigweed+lambsquarters composition values in the data set and this variable strongly influenced the biomass-cover relationship. For example, across these years, the biomass-to-cover slope averaged 1.40 gm−2 %−1 when pigweed+lambsquarters composition = 0 but increased to an average of 4.03 gm−2 %−1 when pigweed+lambsquarters composition = 94% (Tab. III). In 2002, 2004, and 2005, pigweed+lambsquarters composition was uniformly high so this variable did not contribute to biomass differences in these years. When compared across all years at an equivalent pigweed+lambsquarters composition of 94%, the slope of weed biomass per unit weed cover ranged from 3.25 g m−2 %−1 in 2004 to 4.90gm−2 %−1 in 2005 (Tab. III). Thus, the slope was affected more by presence or absence of smooth pigweed and common lambsquarters in the weed community than by the annual weather variation at the same level of pigweed and lambsquarters.
This analysis suggests that weed cover ratings were a comparable metric for assessing weed abundance as weed biomass. Weed cover was probably more comprehensive for assessing weed abundance in the larger full plots (0.1 ha) because of the heterogeneous distribution of weeds. The abundance of such heterogeneous weed vegetation could be captured more easily by a visual rating of the entire plot area than by removing biomass samples from small areas that could never be expected to adequately represent the larger area as a whole. Thus, weed cover ratings, rather than biomass, provided a more reliable estimate of weed abundance by which to estimate crop yield loss on a full-plot scale.
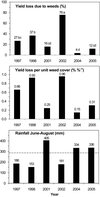 |
Figure 1 Corn grain yield loss due to weed competition and yield loss per unit weed cover in subplots at the Farming Systems Project, Beltsville, Maryland were inversely related to annual rainfall. Rainfall is shown for June through August, which corresponded to the prime corn growing season from approximately pre-sidedress vegetative stage to kernel denting. The 30-year mean rainfall of 289 mm is shown by the dashed reference line. Values of yield loss followed by the same letter are not significantly different (P < 0.05). |
3.3. Corn grain yield
Full-plot corn grain yield varied widely across years and systems (Tab. II). Rainfall during the corn growing season from June through August (Fig. 1) explained much of the yearly variation in yield. Low yields in 1997, 1998, and 2002 were associated with years in which growing-season rainfall was 36 to 47% below the 30-year mean. Highest yields in 2004 and 2005 were associated with growing-season rainfall 16% above average whereas intermediate yields in 2001 were associated with high rainfall that was 40% above average. Corn yield in full-plots was higher in NT than in at least one organic system in 5 of 6 years and higher than all organic systems in 3 of 6 years (Tab. II). The NT system performed no differently than all organic systems in 1998 when droughty weather began before side-dressing nitrogen and extended beyond silking, presumably restricting the ability of the NT corn crop from taking up available nitrogen in that year. Corn yield in Org3 was higher than that in Org2 in 2 of 5 years and yield in Org4 was higher than that in Org2 in 3 of 5 years. Other researchers have also shown that corn following a hay crop yielded higher than when following corn or soybean (Singer and Cox, 1998), particularly for low-input rotations (Clay and Aguilar, 1998).
Percent corn yield loss to weeds was computed from paired weedy and weed-free subplot data. The analysis of variance for yield loss showed that the system main effect (P = 0.3304) and the system by year interaction (P = 0.4062) were not significant, but the main effect of year was significant (P < 0.0001). It is not surprising that there were no system effects since subplots were only established in systems with a substantial level of weeds and, consequently, there was not as wide a range of weed pressure in subplots as in full plots (Tab. I). Yield loss to weeds differed substantially among years (Fig.1); the highest yield loss was in the droughty year of 2002 when there was also high weed cover, and the lowest yield loss was in 2004 when there was both above-average rainfall and relatively low weed cover.
A more precise measure of weed effects on yield was determined by computing the rate of yield loss per unit of weed cover, referred to hereafter as “yield loss rate”. Analysis of covariance demonstrated that yield loss rate was a significant function of the weed cover by year interaction only (R2 = 0.66). Consequently, yield loss rates are presented for each year in Figure 1. The yield loss rates separated into two groupings with relatively high values ranging from 0.66 to 0.96% loss per % cover in the droughty years of 1997, 1998, and 2002, and relatively low loss rates ranging from 0.15 to 0.31% loss per % cover in above-average rainfall years. These results agree with results of previous research showing that weed competition with corn is more severe in dry years (Cowan et al., 1998; Toler et al., 1996). Generally, water taken up by weeds early in the season is unavailable to crops and this early-season depletion can deprive corn of critical soil moisture during seasons with limited water availability but has less impact in years with sufficient subsequent rainfall. Sadeghi et al. (2007) showed that early water removal from the soil profile by weeds was highly correlated with reduced growth of corn during the droughty years of 1998 and 1999 at Beltsville, Maryland.
Differences in the magnitude of yield loss across years can be explained both by differences in yield loss rate and by differences in weed abundance. For example, yield loss rates in 1998 and 2002 were almost identical (0.93 and 0.96% loss per % cover, respectively) but there was an approximately two-fold higher yield loss in 2002 than in 1998 (76 versus 37%, Fig. 1) that can be explained by the approximately two-fold higher weed cover in 2002 than in 1998 (Tab. I). Alternately, the lower yield loss rate in the wet year of 2001 compared to the dry year of 1998 (0.25 versus 0.93 % loss per % cover) explains why the overall yield loss of 2001 was only half that of 1998 despite there being similar levels of weed cover in those years (Tab. I).
3.4. Estimated weed-free corn yields
There was a similar pattern of system effects on estimated weed-free corn yield in full plots as there was on corn yields in weedy full plots (Tab. II). Estimated full-plot weed-free corn yields in Org2 remained lower than those in the conventional NT system in 5 of 6 years and were lower than those in Org4 in 3 of 5 years. For example, in 1997, the full plot weedy yield was 55% lower in Org2 (1.67Mg ha−1) than in NT (3.70Mg ha−1) while estimated weed-free yield was 38% lower in Org2 (2.56Mg ha−1) than in NT (4.14Mg ha−1). Estimated weed-free yields also were lower in Org2 than in NT in 2001, 2002, and 2005. There also were significant differences in estimated weed-free yield between Org2 and at least one of the longer organic rotations in 2001, 2002, and 2005.
These results suggest that only a portion of the yield differences among conventional and organic systems could be accounted for by weed competition, and that other factors contributed to these yield differences as well. The regression of estimated full plot weed-free yield on nitrogen availability was significant (P < 0.001) for the years with above-average rainfall (2001, 2004, 2005) and the below-average rainfall year of 1997 (P = 0.048) but was not significant for the below-average rainfall years of 1998 (P = 0.077) and 2002 (P = 0.131). Almost sixty percent of the variability in weed-free yield could be explained by differences in nitrogen availability in years with above-average rainfall (Fig. 2). There was an estimated increase of 36 kg ha−1 of grain yield per unit increase in nitrogen in these years. In the three dry years, nitrogen availability was either unrelated to weed-free corn yields or explained a more modest yield increase of 18 kg ha−1 per unit nitrogen that accounted for only 37% of the variability in weed-free yield in 1997. These results are reasonable since years with above-average rainfall would be expected to provide higher yield potential and exhibit a larger response to available nitrogen.
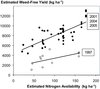 |
Figure 2 Estimated weed-free corn yield increased linearly as a function of estimated nitrogen availability in years with above-average rainfall (2001, 2004, and 2005) but either did not increase (1998 and 2002) or increased at a lower rate in 1997 when rainfall was below-average. The equation for pooled data across 2001, 2004, and 2005 is Y = 4411 + 36.1X where Y is estimated weed-free yield and X is estimated nitrogen availability (R2 = 0.586). The equation for 1997 data is Y = 1638 + 17.7X (R2 = 0.368). |
The relative importance of nitrogen as well as weed competition for explaining yield differences in these systems is consistent with a covariance analysis conducted on full plot corn yield data and reported in Cavigelli et al. (2008). That covariance analysis demonstrated that corn yield was significantly affected by weeds, available nitrogen, and corn population. Specifically, an estimated 70–75% of the yield difference between conventional and organic systems was accounted for by nitrogen availability, 21–25% by weed competition, and 3–5% by corn population. Generally, the subplot analysis reported here confirms the covariance analysis, demonstrating that weed competition alone was not sufficient to account for system yield differences and that nitrogen availability explained a substantial amount of the remaining differences in estimated weed-free yield after weed effects were removed. In addition, the analysis of subplot weed competition and estimated weed-free yields in relation to annual rainfall revealed the importance rainfall played in determining the impact of weed competition and nitrogen availability on corn yields.
4. CONCLUSION
A methodology establishing paired weed-free and weedy subplots within the larger plots of a long-term systems experiment was highly useful for determining the impact of weeds on crop yield. The metric weed cover (percent of soil covered by weed vegetation) proved to be a useful surrogate for weed biomass and can be used more easily to determine the abundance of weeds throughout the large plot areas of long-term experiments than measurement of weed biomass which can only be made at selected locations within a plot. Weed cover assessments provided a critical link for estimating yield loss to weeds at a full plot scale from yield loss data determined at a subplot scale. This methodology will be useful to researchers conducting long-term experiments on large plots where multiple production factors vary among systems and a factorial arrangement of these production factors is not built into the design of the experiment.
The use of subplots at the Beltsville Farming Systems Project showed that corn yield loss to weed competition was highly variable, ranging from 4 to 76% and the rate of yield loss per unit of weed cover varied by approximately six-fold across years. This analysis revealed that variability in the yield loss rate was explained by rainfall whereby the highest yield loss rates occurred in years with below average rainfall and the lowest yield loss rates occurred in years with above average rainfall. Estimation of weed-free yields in the full plots from yield loss rates derived from the subplots demonstrated that the effect of weed competition accounted for only a portion of the corn yield differential between conventional and organic systems, while nitrogen availability accounted for a majority of the differential unaccounted for by weeds. These results permitted an understanding of weed and nitrogen effects relative to weather conditions; weed impact on crop yields was greater and nitrogen impact smaller under dry conditions whereas nitrogen had a larger impact and weeds a lesser impact during years with adequate rainfall.
References
- Canner S.R., Wiles L.J., McMaster G.S. (2002) Weed reproduction model parameters may be estimated from crop yield loss data, Weed Sci. 50, 763–772. [CrossRef] [Google Scholar]
- Cathcart R.J., Swanton C.J. (2003) Nitrogen management will influence threshold values of green foxtail in corn, Weed Sci. 51, 975–986. [CrossRef] [Google Scholar]
- Cavigelli M.A., Hima B.L., Hanson J.C., Teasdale J.R., Conklin A.E., Lu Y.C. (2009) Long-term economic performance of organic and conventional field crops in the mid-Atlantic region, Renew. Agric. Food Sys. 24, 102–119. [CrossRef] [Google Scholar]
- Cavigelli M.A., Teasdale J.R., Conklin A.E. (2008) Long-term agronomic performance of organic and conventional field crops in the mid-Atlantic region, Agron. J. 100, 785–794. [CrossRef] [Google Scholar]
- Clark M.S., Szlavecz K., Cavigelli M.A. (2006) Comparison of ground-beetle assemblages in conventional, organic and no-till farming systems of the mid-Atlantic region, Environ. Entomol. 35, 1304–1312. [CrossRef] [Google Scholar]
- Clay S.A., Aguilar I. (1998) Weed seedbanks and corn growth following continuous corn or alfalfa, Agron. J. 90, 813–818. [CrossRef] [Google Scholar]
- Cowan P., Weaver S.E., Swanton C.J. (1998) Interference between pigweed, barnyardgrass, and soybean, Weed Sci. 46, 533–539. [Google Scholar]
- Drinkwater L.E. (2002) Cropping systems research: Reconsidering agricultural experimental approaches, HortTechnology 12, 355–361. [Google Scholar]
- Evans S.P., Knezevic S.Z., Lindquist J.L., Shapiro C.A., Blankenship E.E. (2003) Nitrogen application influences critical period for weed control in corn, Weed Sci. 51, 408–417. [CrossRef] [Google Scholar]
- Fausey J.C., Kells J.J., Swinton S.M., Renner K.A. (1997) Giant foxtail interference in nonirrigated corn, Weed Sci. 45, 256–260. [Google Scholar]
- Gallandt E.R., Liebman M., Corson S., Porter G.A., Ullrich S.D. (1998) Effects of pest and soil management systems on weed dynamics in potato, Weed Sci. 46, 238–248. [Google Scholar]
- Kropff, M.J., van Laar H.H. (1993) Modelling Crop-Weed Interactions, CAB International, Wallingford, UK. [Google Scholar]
- Liebman M., Davis A.S. (2000) Integration of soil, crop and weed management in low-external-input farming systems, Weed Res. 40, 27–47. [CrossRef] [Google Scholar]
- Lindquist J.L., Mortensen D.A., Clay S.A., Schmenk R., Kells J.J., Howatt K., Westra P.A. (1996) Stability of corn-velvetleaf interference relationships, Weed Sci. 44, 309–313. [Google Scholar]
- Lindquist J.L., Mortensen D.A., Westra P., Lambert W.J., Bauman T.T., Fausey J.C., Kells J.J., Langton S.J., Harvey R.G., Bussler B.H., Banken K., Clay S., Forcella F. (1999) Stability of corn-foxtail interference relationships, Weed Sci. 47, 195–200. [Google Scholar]
- Marriott E.E., Wander M.M. (2006) Total and labile soil organic matter in organic and conventional farming systems, Soil Sci. Soc. Am. J. 70, 950–959. [CrossRef] [Google Scholar]
- Massinga R.A., Currie R.S., Trooien T.P. (2003) Water use and light interception under Palmer amaranth and corn competition, Weed Sci. 51, 523–531. [CrossRef] [Google Scholar]
- Ryan M., Mortensen D., Bastiaans L., Teasdale J., Mirsky S., Curran W., Seidel R., Wilson D., Hepperley P. (2010) Elucidating the apparent maize tolerance to weed competition in long-term organically managed systems, Weed Res. 50 (in press). [Google Scholar]
- Sadeghi A.M., Starr J.L., Teasdale J.R., Rosecrance R.C., Rowland R.A. (2007) Real-time soil profile water content as influenced by weed-crop competition, Soil Sci. 172, 759–769. [CrossRef] [Google Scholar]
- Singer J.W., Cox W.J. (1998) Corn growth and yield under different crop rotation, tillage, and management systems, Crop Sci. 38, 996–1003. [CrossRef] [Google Scholar]
- Teasdale J.R., Coffman C.B., Mangum R.W. (2007) Potential long-term benefits of no-tillage and organic cropping systems for grain production and soil improvement, Agron. J. 99, 1297–1305. [CrossRef] [Google Scholar]
- Teasdale J.R., Mangum R.W., Radhakrishnan J., Cavigelli M.A. (2004) Weed seedbank dynamics in three organic farming crop rotations, Agron. J. 96, 1429–1435. [CrossRef] [Google Scholar]
- Toler J.E., Guice J.B., Murdock E.C. (1996) Interference between johnsongrass, smooth pigweed, and soybean, Weed Sci. 44, 331–338. [Google Scholar]
- Tollenaar M., Nissanka S.P., Aguilera A., Weise S.F., Swanton C.J. (1994) Effect of weed interference and soil nitrogen on four corn hybrids, Agron. J. 86, 596–601. [CrossRef] [Google Scholar]
- Walz E. (1999) Final Results of the Third Biennial National Organic Farmers’ Survey, Organic Farming Research Foundation, Santa Cruz, CA. [Google Scholar]
- Zimdahl R.L. (2004) Weed-Crop Competition, A Review, Second Edition, Blackwell Publishing, Ames, Iowa. [Google Scholar]
All Tables
Models for defining the relation of weed biomass and weed cover ratings at the Beltsville Farming Systems Project. The overall model of weed biomass, W (g m−2, as a function of the percent total weed cover, C, and the sum of the percent composition of smooth pigweed plus common lambsquarters (P + L) had significant C × Year and C × (P + L) × Year interactions (n = 69, P < 0.0001, R2 = 0.819).
All Figures
|
Figure 1 Corn grain yield loss due to weed competition and yield loss per unit weed cover in subplots at the Farming Systems Project, Beltsville, Maryland were inversely related to annual rainfall. Rainfall is shown for June through August, which corresponded to the prime corn growing season from approximately pre-sidedress vegetative stage to kernel denting. The 30-year mean rainfall of 289 mm is shown by the dashed reference line. Values of yield loss followed by the same letter are not significantly different (P < 0.05). |
| In the text | |
|
Figure 2 Estimated weed-free corn yield increased linearly as a function of estimated nitrogen availability in years with above-average rainfall (2001, 2004, and 2005) but either did not increase (1998 and 2002) or increased at a lower rate in 1997 when rainfall was below-average. The equation for pooled data across 2001, 2004, and 2005 is Y = 4411 + 36.1X where Y is estimated weed-free yield and X is estimated nitrogen availability (R2 = 0.586). The equation for 1997 data is Y = 1638 + 17.7X (R2 = 0.368). |
| In the text | |