Free Access
Figure 1
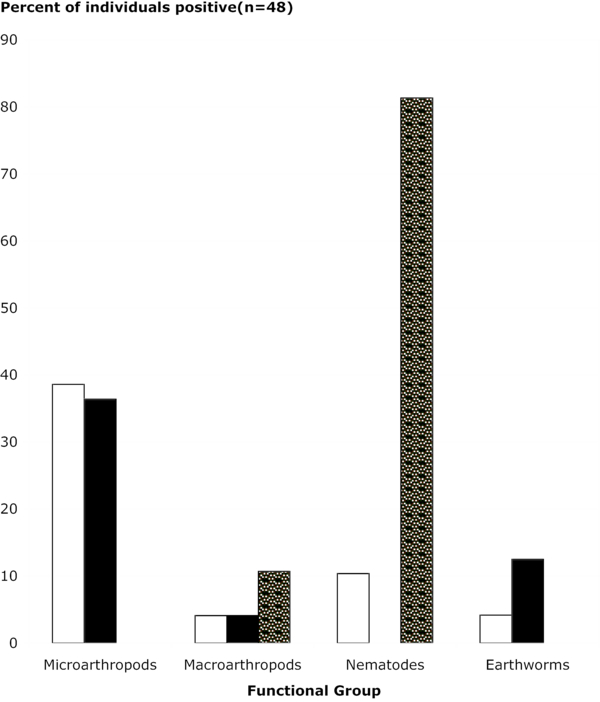
Proportion of individuals positive for cp4 epsps (n = 48 for each functional group, at each harvest). White, black and hatched bars represent May, August and October harvests, respectively. There were neither samples for microarthropods nor earthworms for the October harvest.